| OptiLayer Thin Film software provides various options which enable you to conveniently import experimental data from various measurement devices. The program also has a software utility that allows the extraction of numerical data from any ASCII file. This utility makes OptiLayer compatible with other commercial thin film packages or with your own software. OptiLayer allows import of any other data from external files, namely, optical constants, design structures, light sources, and detectors.
Also, you can easily import of data files from other commercial software packages. OptiChar and OptiRE are able to import data from almost all well-known spectrophotometers and ellipsometers and widely used data formats. |
|
|
|
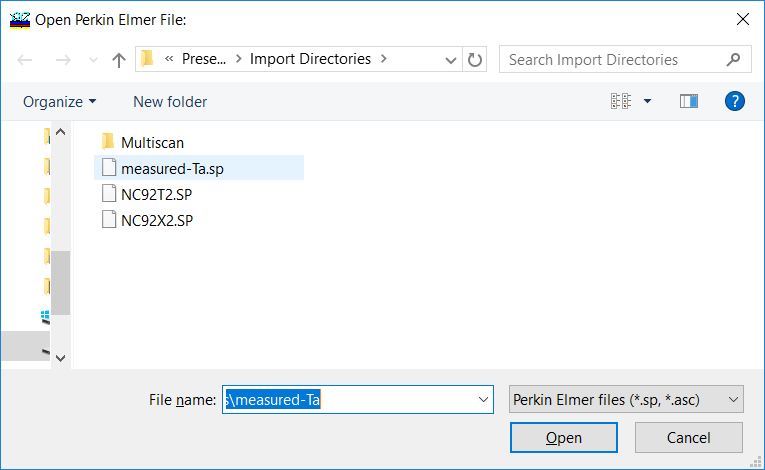
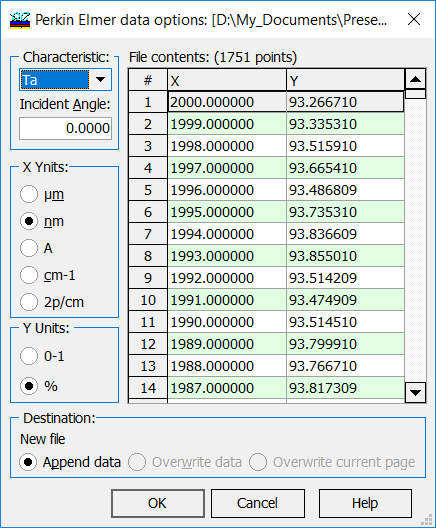
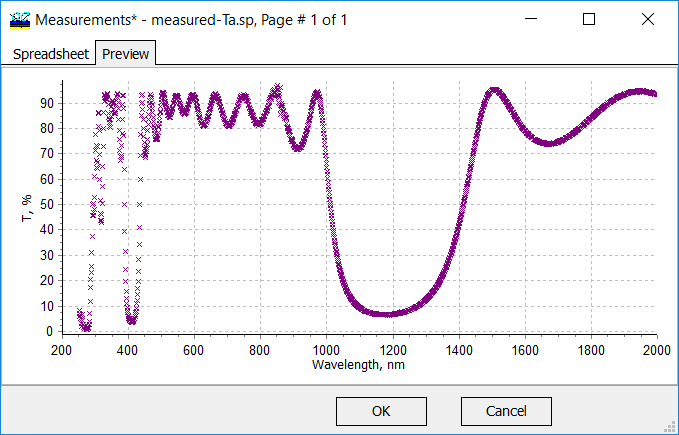
| Import of data from Perkin Elmer spectrophotometers. You need three clicks to transfer measurements from Perkin Elmer spectrophotometers.
In the same way the *.dx (JCAMP-DX) data files can be converted to OptiChar/OptiRE measurement database. |
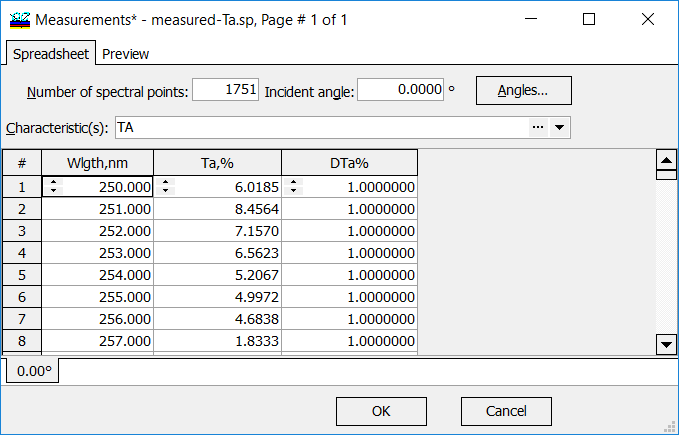
Example: Import measured transmittance from Perkin Elmer spectrophotometer (average polarization, normal incidence, spectral units are nanometers, transmittance is given in %).
|
 |
 |
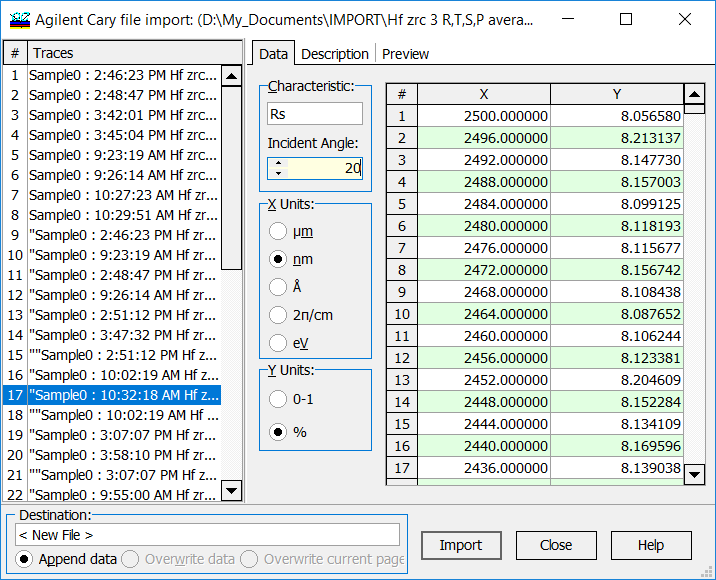
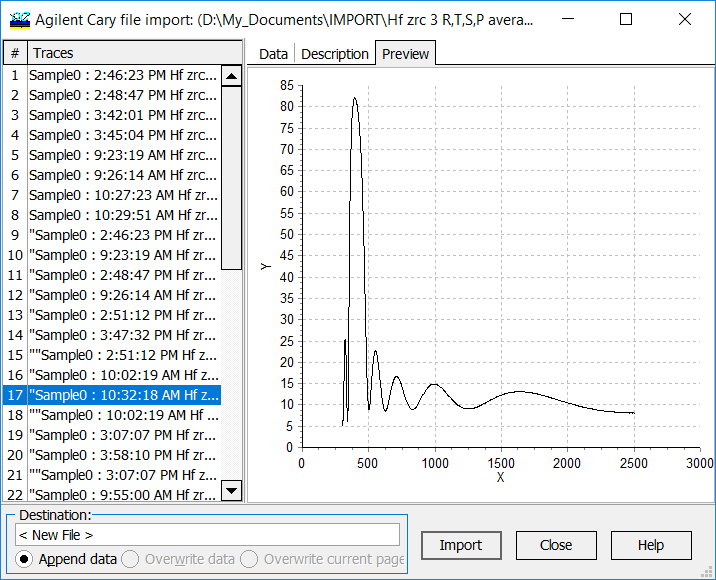
| Import from Agilent spectrophotometers. OptiLayer allows import of data from Agilent Cary spectrophotometers. Usually Agilent Cary files include several so-called traces. The list of available traces is shown in the left part of the dialog window.
|
It is possible to switch between different traces and view description of measurements and Preview data. In the newest OptiLayer version 12.12, the incidence angle and polarization are identified automatically. It is very easily to collect the multi-angle measurements in one file.
|
| Import from two-column data files. This option is useful when it is necessary to import simple ASCII two-column files. Usually the first column is the wavelength (or wavenumber), while the second column is some characteristic (Reflectance, Transmittance, etc.).
This option can be used also when you import data from FTIR spectrophotometers. |
 |
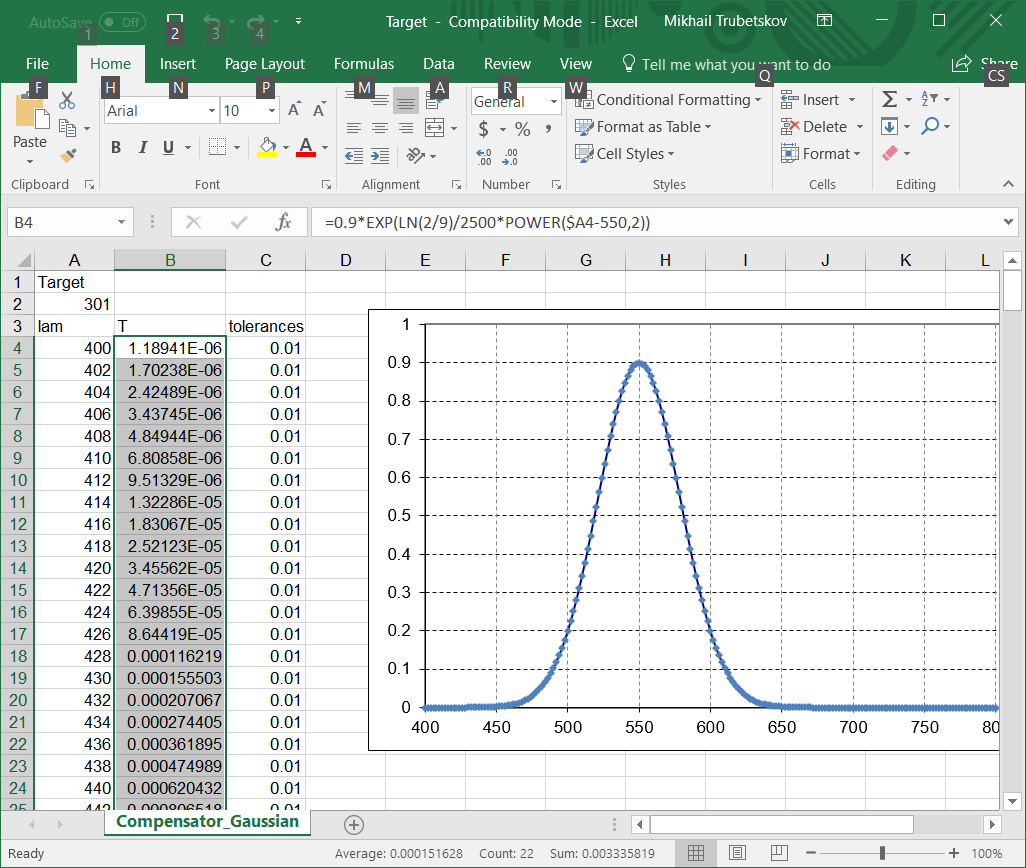
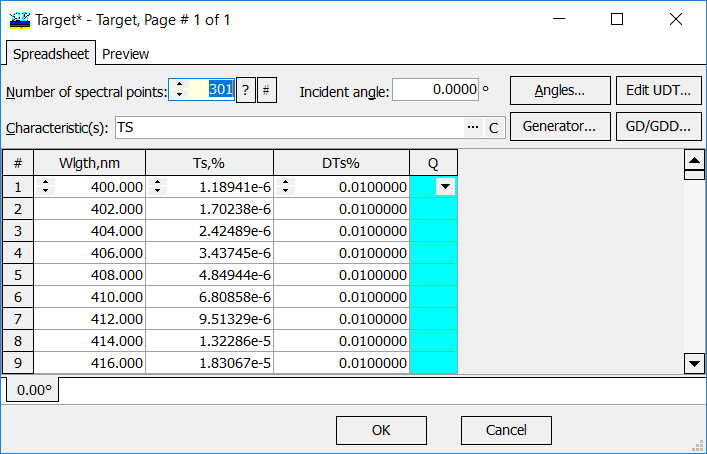
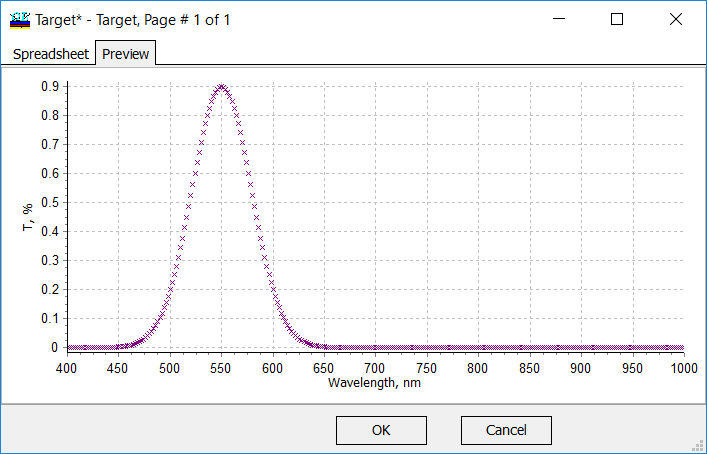
| Import from Excel, Origin. OptiLayer allows you to import measurements data, optical constants, targets, design structures, light sources, integral weights from MS Excel and Origin using Copy/Paste.
Example (right panel): target transmittance is a Gaussian and it is that this target is not standard. Hence, it is not possible to specify such a target using the OptiLayer target generator. You can import complicated targets from Excel, Origin etc. using Copy/Paste (left and right panels below). The same is valid for refractive indices/extinction coefficients/light sources/detectoors/design structures.
|
 |
 |
 |
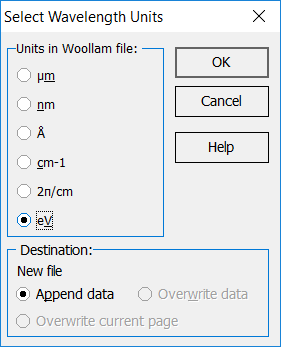
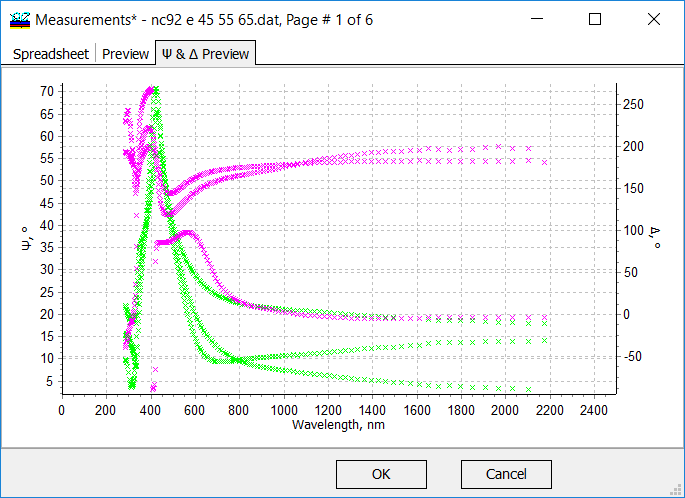
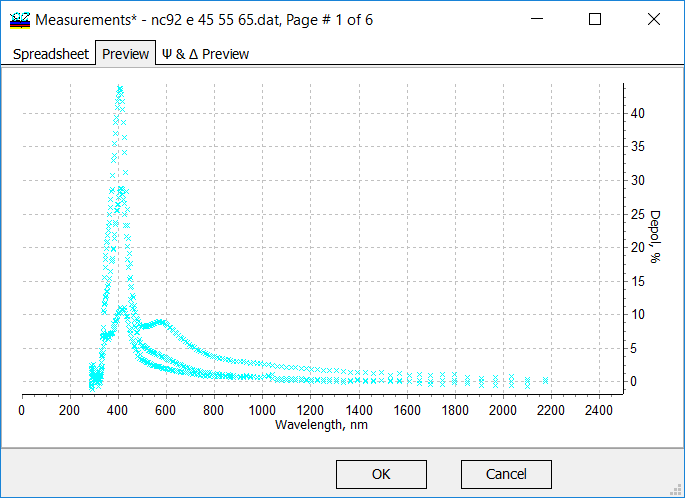
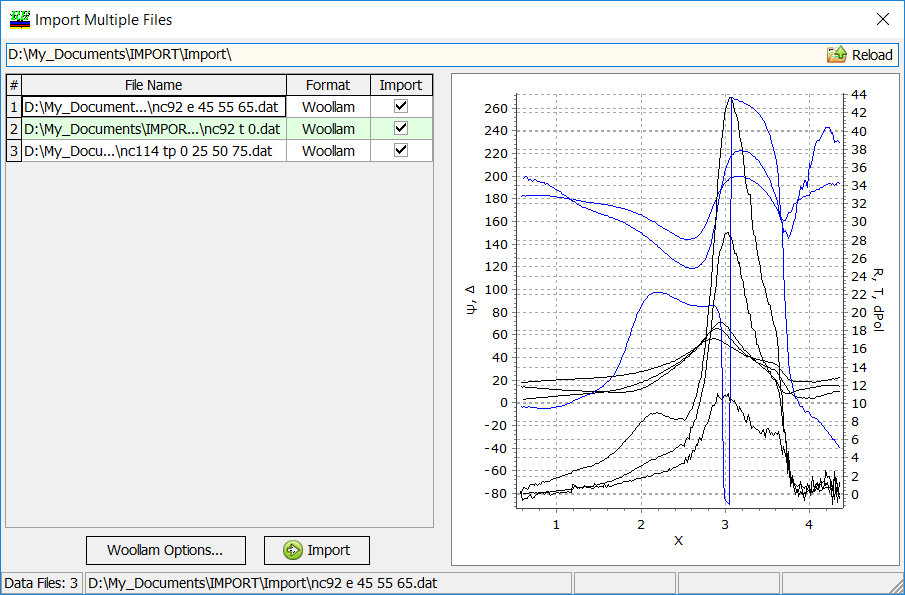
| Import from Woollam ellipsometers. Woollam files are ASCII files organized in 6 columns: Wavelength, Angle of Incidence, Psi, Delta, Tolerance for Psi, Tolerance for Delta.
Woollam files don’t contain the information concerning wavelength units. For this reason after opening a file in the Woollam’s format it is necessary to make a proper selection in the Units in Woollam file box, specifying actual units for the wavelength in the Woollam file (right panel). Modern Woollam ellipsometers measures depolarization and transmittance as well. Depolarization measurements are recorded for each incidence angle after Psi, Delta measurements in the Woollam files. Measurement transmittance files contain spectral units, angle of incidence, transmittance values and tolerances. Example (panels below): import of Psi and Delta and depolarization measured at 45, 55, and 65 degrees. Similar import procedures exist for Horiba and Sentech ellipsometers. |
 |
 |
 |
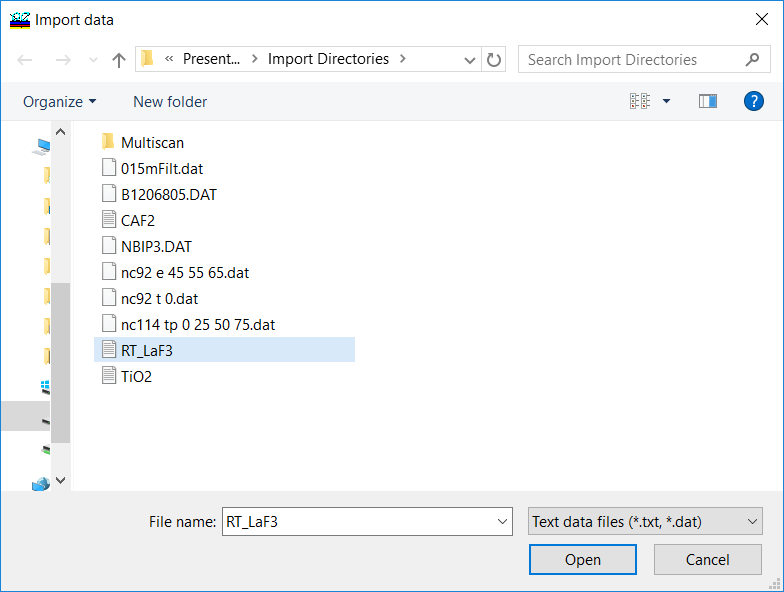
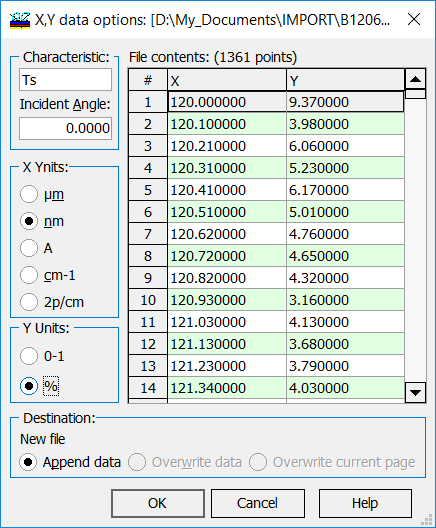
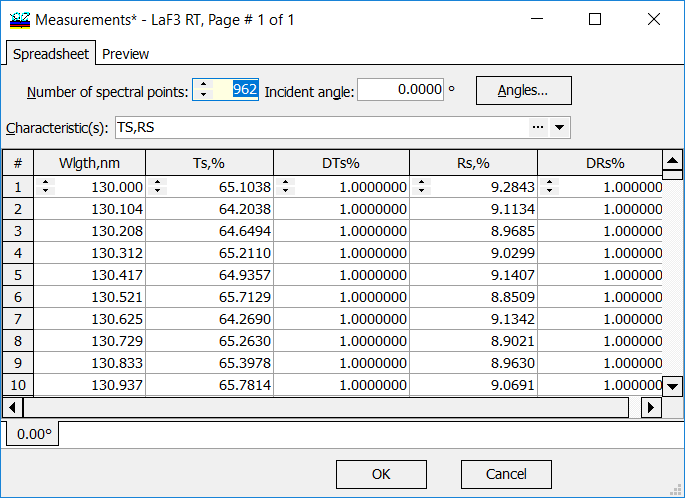
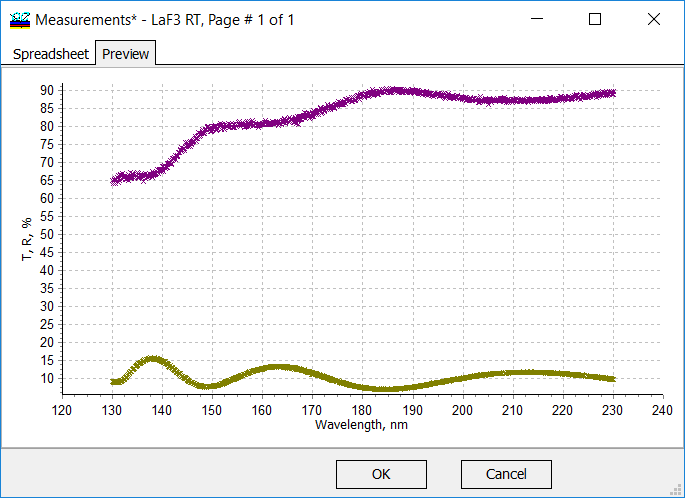
| Import from arbitrary text files. You can import measurements data/optical constants/design structures from any ASCII file. The columns can be separated by any delimiters.
|
Example: import of reflectance/transmittance data from a home-made spectrophotometer.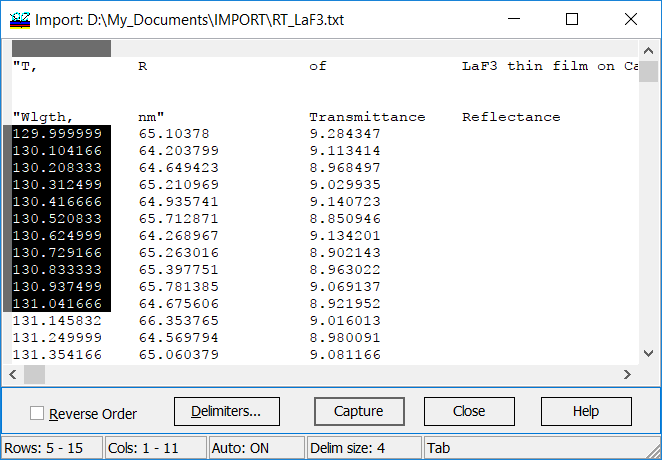 |
 |
 |
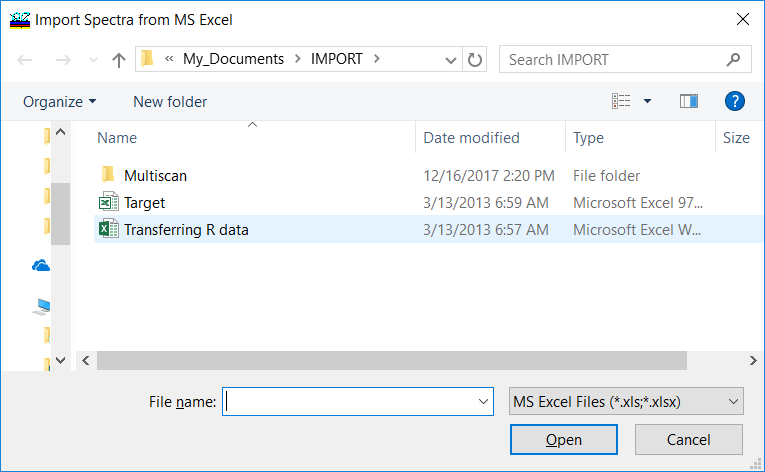
| Import Spectra from Excel. This command first opens File Open dialog, where you need to select a corresponding MS Excel file with measurement data.
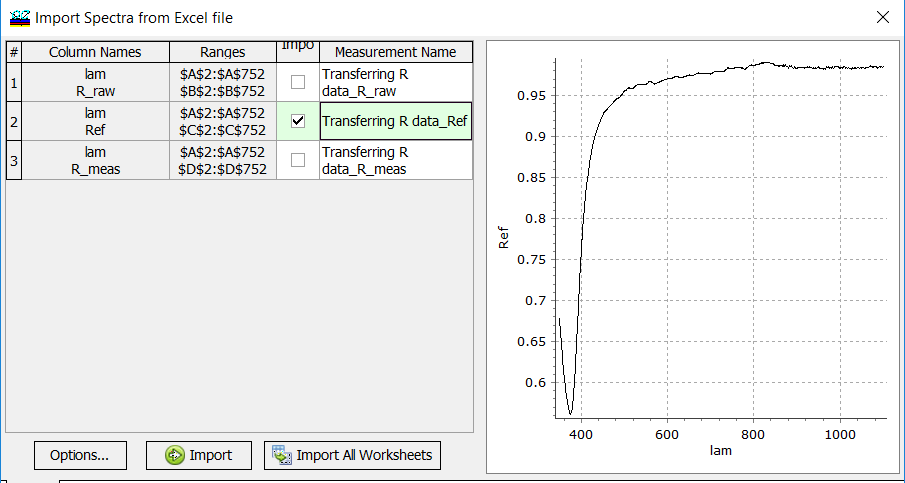
OptiChar performs smart scan of Excel file layout and represents all extracted data in the Import Spectra from Excel window. On the bottom all worksheets are listed and can be changed using tabs similar to Excel file, each extracted spectrum is represented in the list to the left with specification of column name, cell range and future measurement file name.
|
The names can be adjusted if necessary editing cells in the Measurement Name column. Import column allows to deselect some spectra excluding them from Import operation. It is important to use Options dialog in order to set correct types of spectra, incidence angle and X- and Y-axis units.
|
|
Import Multiple Files option greatly simplifies measurement data import. Using this option you can import many files in one simple operation. File format is recognized automatically by OptiChar/OptiRE. Import Multiple Files command opens the corresponding window. On the top of the window the currently opened folder is presented, it could be changed using a Browse button at the right side. Reload button initiates reloading of all files in the current folder, it may be useful, if new files were added, or some files were deleted in this folder by some other program. Instead of using Browse button it is possible to use drag-and-drop operation. Simply select the files of interest or a folder containing these files and drop it onto the right part of the window.
|
 |
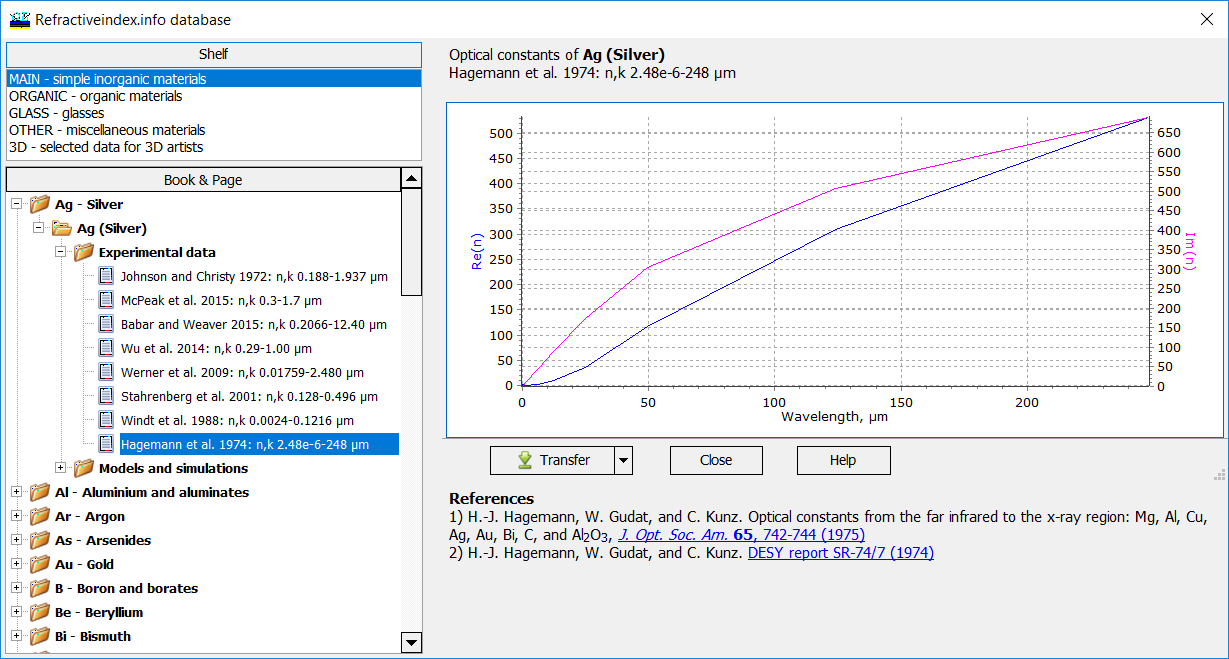
| OptiLayer provides a convenient interface for the navigation through RefractiveIndex.INFO database.
In the left pane of the RefractiveIndex.INFO database window it is possible to select Shelf section and in the Book & Page part – a particular material of interest. The right pane shows the related detailed information including refractive index dispersion and the initial origin of the data. With Transfer button it is possible to transfer the data to the current Substrate database of you OptiLayer Problem Directory. You can transfer the data to the Layer Material database or Substrate database of your current Problem Directory. |
 |
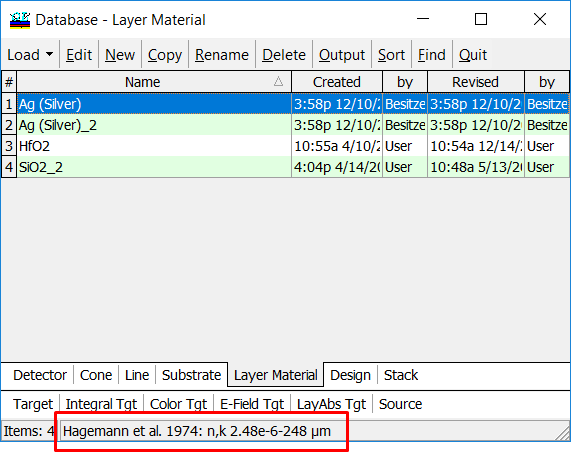 |
Transferred materials have the corresponding literature source in the comment field. You can use transferred materials/substrates for design process or for verification of your characterization results. |
OptiLayer provides user-friendly interface and a variety of examples allowing even a beginner to effectively start to design and characterize optical coatings. Read more…
Comprehensive manual in PDF format and e-mail support help you at each step of your work with OptiLayer.
If you are already an experienced user, OptiLayer gives your almost unlimited opportunities in solving all problems arising in design-production chain. Visit our publications page.
Look our video examples at YouTube
OptiLayer videos are available here:
Overview of Design/Analysis options of OptiLayer and overview of Characterization/Reverse Engineering options.
The videos were presented at the joint Agilent/OptiLayer webinar.